Characterizing a body of water
 [1]
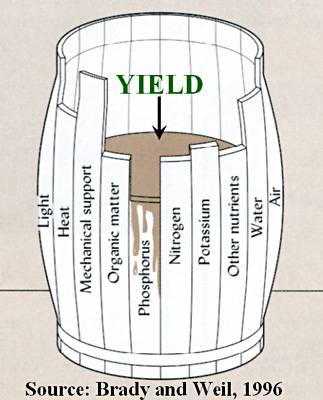
[1]So, what are we measuring within these transects and how is the data comparable? Habitat Assessment [Expanded] lists typical evaluative parameters used to obtain current vitals of a river and gain insight on contemporaneous instream dynamics. The template considers abiotic factors as well as biotic factors, that act upon a stream community. Physicochemical variables can be directly evaluated by measuring the concentration of dissolve and suspended substances in the water that may come from atmosphere, entering the system via precipitation or are picked up from soil, vegetation, and other sources via runoff (Murdoch). Biotic sampling can be implemented to survey the local stream community, quantify biodiversity, and (by indexing the presence and abundance of bioindicators) can similarly evidence less tangible parameters. Most water quality parameters are considered limiting factors, as the proportional presence and concentration of these parameters can alter aspects of water chemistry, having a direct effect on population "yield" and constitution (illustrated in Brady and Wiel's classic barrel model, pictured above).
Limiting Factors
A limiting factor is an aspect of the environment that limits population distribution (and per our interests, jointly affects trophic composition). These can be physical/spatial limitations (mechanical supports/substrate, stream current/velocity, temperature, light, and heat), chemical constituents (phosphorous, nitrogen, potassium, and other nutrients), or biotic interactions (competition, predation, and herbivory).
Comparing BMIs:
Pollution Tolerance, Taxa richness, and Trophic Guild Composition
Benthic Macroinvertebrates and Pollution Tolerance
Organic pollution can manifest as excess nutrients or sediments, causing low dissolved oxygen conditions. This is especially problematic in areas of high sedimentation and impoundment. In general, mayflies, stoneflies, and caddisflies have the lowest tolerance to pollution (existing in well oxygenated areas and areas with low sedimentation), while midges aquatic worms, leeches, and blackflies, have the highest (existing within sediment and areas of high embeddedness). Beetles, craneflies and crustaceans tend to be in the "somewhat tolerant" (Murdoch, p.135).
Be the ascription pollution tolerant or pollution intolerant, we are really discussing oxygen as a limiting factor. Benthic macroinvertebrates (BMIs) have varying oxygen demands, requiring a specific current velocity for respiration and distribution, and display a substrate preference relative to their metabolic needs. Though someBMIs are habitat generalists, others predictably appear within a narrow set of parameters.
Generalizations about the consistent life history and behavioral patterns of BMIs can be translated into a biotic index. A biotic index, is a comparative metric used to evaluate stream community composition and assess water quality. This streamlined platform requires the cataloging and indexing of local instream BMIs. Each order (or family, depending on evaluative technique) is assigned a pollution tolerance value (scale of 1-10). Their the proportional quantification (relative to sample size) is then entered into a formula that takes into account these pollution tolerance values (and collection method) to calculate the overall water pollution tolerance of the community, and conjunctively describe current water quality conditions.
Choosing an Index
Not just any index will do. The science behind the scales is a little more sensitive than I care to divulge, but each index is customized to a particular region... An intermittent creek in the the Texas Hill Country would fair poorly on a scale tailored for perennial streams in the western Great Lakes region; clearly an inappropriate metric in this scenario.
Not just any index will do. The science behind the scales is a little more sensitive than I care to divulge, but each index is customized to a particular region... An intermittent creek in the the Texas Hill Country would fair poorly on a scale tailored for perennial streams in the western Great Lakes region; clearly an inappropriate metric in this scenario.
The scale chosen for this field study, is Paul's Biotic Index (PBI) pictured below.
Using a Biotic Index
Using a Biotic Index
 [2]
[2]Referencing the scale is pretty self explanatory (uh, see above). But getting final, representative figures worth comparing is a whole other matter.
Other Intel
Further extrapolations can be made from the same raw data collected for a biotic index.
Biodiversity: Taxa richness directly correlates with the total number of taxa. The greater the taxa richness, the greater the diversity of BMIs.
Trophic Composition: Each specimen group can be further classified by a shared feeding strategy (this requires background knowledge of an organism's life history and habitat/substrate preference). Assessing their proportional relationships of these functional feeding groups can describe the trophic dynamics of the sampled community.
Infographics!>>>
Refs--
Engevold, Paul. PBI and Trophic Structure. N.p.: n.p., n.d. Print.
Engevold, Paul. Stream Comparisons - The Parts Equal the Whole. N.p.: n.p., n.d. Print.
Murdoch, Tom, Martha Cheo, and Kate O'Laughlin. The Streamkeeper's Field Guide: Watershed Inventory and Stream Monitoring Methods. Everett, WA: Adopt-a-Stream Foundation, 1996. Print.
Images:
[1]
[2]
No comments:
Post a Comment